Toronto Real Estate Sales Jump Double Digits, Just Under Typical Volumes Again


A big Swiss bank recently ranked Toronto real estate the second biggest bubble in the world, but the city can’t hear them. Toronto Real Estate Board (TREB) numbers show price growth accelerating in September. The increase in growth comes after sales and inventory returned to typical volumes.
Toronto Real Estate Prices Rise Over 5%
The price of a home across Greater Toronto advanced further last month. TREB reported a benchmark price of $805,000 in September, up 5.23% from last year. The City of Toronto benchmark hit $890,000, up 5.74% over the same period. These are huge numbers for growth, and most of the movement is in the condo apartment market.
Greater Toronto Benchmark Price
The price of a “typical†composite home across Greater Toronto.
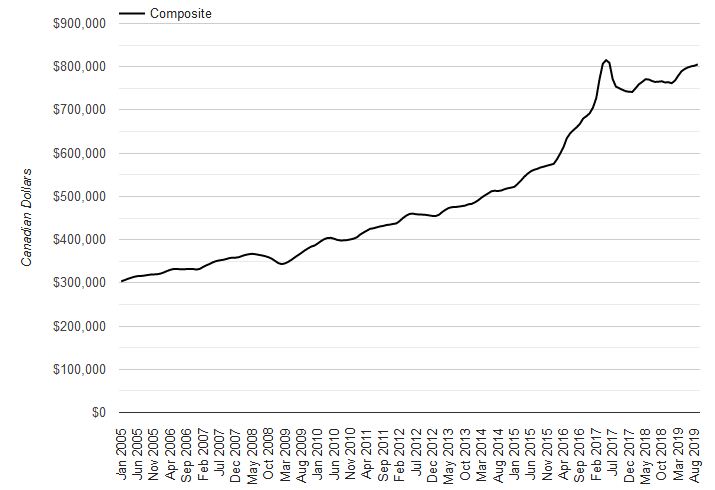
Source: TREB. Better Dwelling.
The rate of price growth is heading higher, and prices are getting close to the all-time high. The 5.24% 12-month increase is the fourth consecutive month it’s shown growth. It’s also the highest annual growth since January 2018. A lot of this growth has to do with the comparison to last year. Growth following a period of negative growth, always looks abnormally high. That’s the market trying to figure out where the natural level should be.
Greater Toronto Benchmark Price Change
The annual percent change of TREB’s benchmark price for all home types.
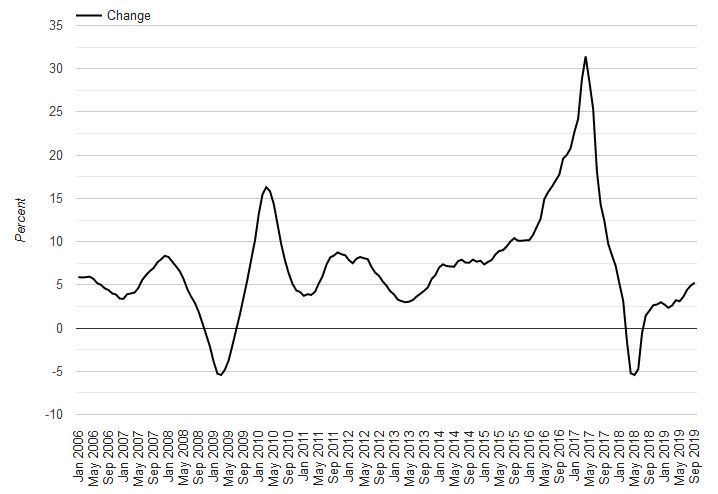
Source: TREB. Better Dwelling.
The median sale price of a Greater Toronto home is showing growth, but gives a very different picture. TREB reported a median sale price of $720,000 in September, up 5.88% from last year. The City of Toronto median sale price high $738,000, up 6.95% from last year. This means more than half of homes sold in TREB were 10.55% below the “typical†price. In the City of Toronto, more than half of homes sold 17.02% below the typical price as well. That’s a big gap between expectations and reality.
The average sale price showed similar growth to other price segments, but came in much higher. TREB’s average sale price reached $843,115 in September, up 5.81% from the same month last year. The City of Toronto average hit $913,096, up 5.64% from the same month last year. Average prices aren’t adjusted for size, so they’re most useful for understanding volumes.
Greater Toronto Average Sale Price Change
The annual percent change of the average sale price of all homes.
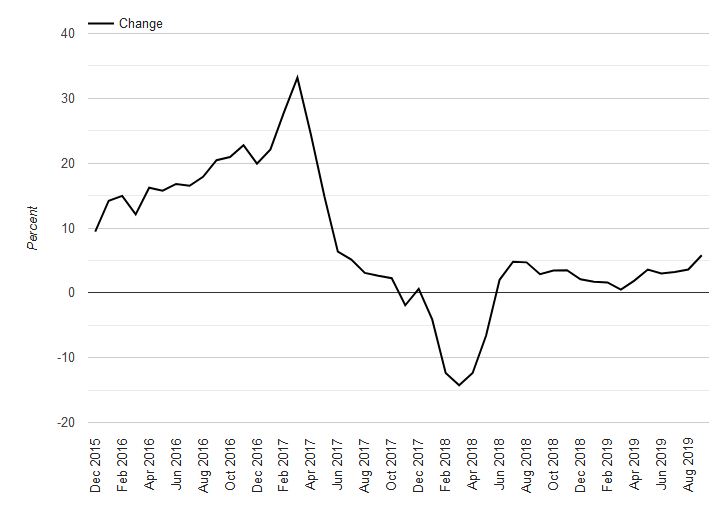
Source: TREB, Better Dwelling.
Greater Toronto Real Estate Sales Make Double Digit Jump
Sales of Greater Toronto real estate made a big bounce back towards normal levels for the region. TREB reported 7,825 sales in September, up 21.22% from the same month last year. The City of Toronto represented 2,995 of the sales, up 21.35% over the same period. For context, the volumes are 1.91% below the 5-year average for the month. Huge annual improvement, but it doesn’t quite make the market “hot.â€
Greater Toronto September Home Sales
The total home sales across TREB by year, for the month of September.
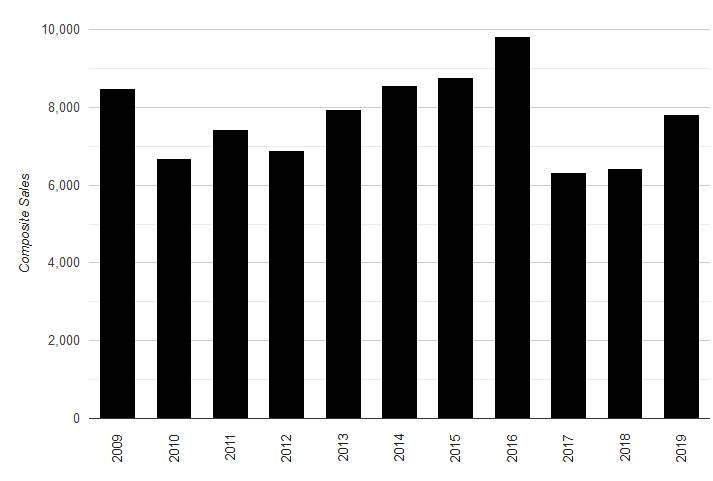
Source: TREB, Better Dwelling.
Greater Toronto Real Estate Resale Inventory Is Falling
The number of new homes for sale might be swelling, but resale inventory is falling. TREB reported 15,611 new listings in September, down 1.94% from the same month last year. The City of Toronto represents 5,810 of those listings, up 6.48% over the same period. A drop in new listings, and much higher sales helped to firm up total inventory on the market.
Greater Toronto Sales To New Listings
The number newly listed units per month, in contrast to sales.
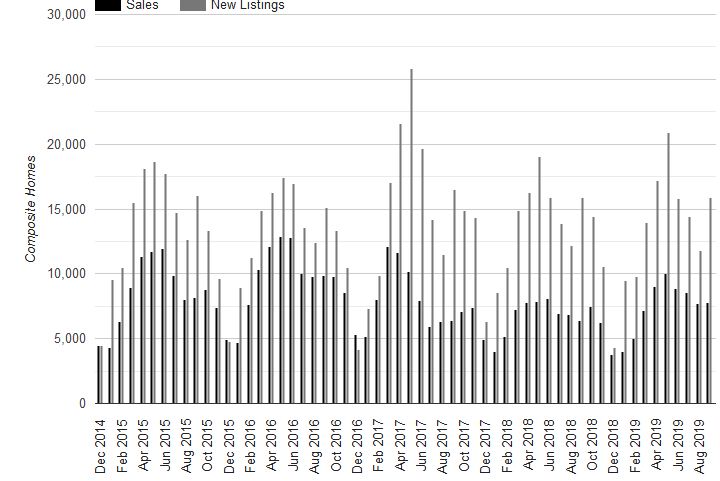
Source: TREB, Better Dwelling.
The number of active listings, a.k.a. total inventory, made a sharp fall from last year. TREB reported 17,254 active listings in August, down 14.11% from the same month last year. The City of Toronto represents 5,479 of those listings, down 6.02% over the same period. For context, this number is 0.75% higher than the 5-year average for the month. Falling inventory might seem sharp, but it’s close to what’s typical for the period.
Greater Toronto September Active Listings
The total of active home listings across TREB by year, for the month of September.
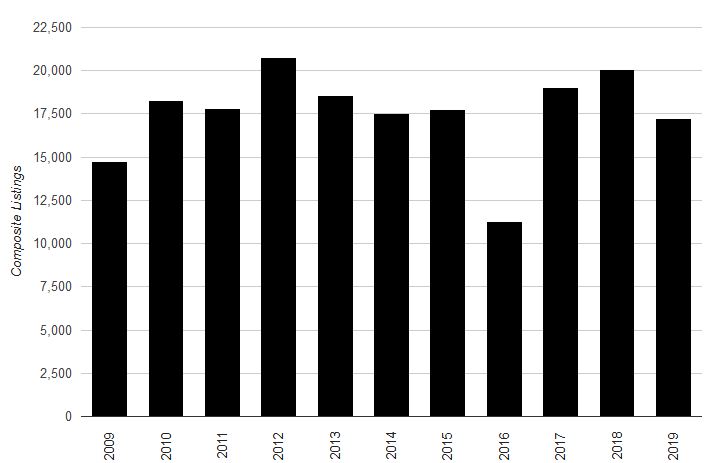
Source: TREB, Better Dwelling.
Greater Toronto real estate is seeing sales and inventory return to normal. Price growth is moving at a faster than usual pace, accelerating into winter. Part of this has to do with the way asset prices follow negative growth. Following negative periods of growth, markets tend to overcompensate. However, a lot of this is the expectations politicians will inject money into the market.
![]()

Comments
There are 0 comments on this post